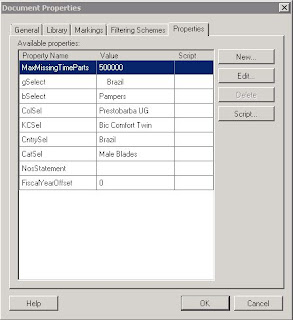
1) Iron Python script to update document Property:
# Import Class
from Spotfire.Dxp.Data import *
# Set variable for table name
tableName='Mapping'
# Set variable for column name in the table
columnToSearch='KCVal'
# Assign "Mapping" table as active table
activeTable=Document.Data.Tables[tableName]
# capture marking and set value of "Category" and "KCVal" column to CatVal and CellVal variable
rowIndexSet=Document.ActiveMarkingSelectionReference.GetSelection(Document.Data.Tables[tableName]).AsIndexSet()
if rowIndexSet.IsEmpty !='false':
CellVal = Document.Data.Tables[tableName].Columns[columnToSearch].RowValues.GetFormattedValue(rowIndexSet.First)
CatVal = Document.Data.Tables[tableName].Columns['Category'].RowValues.GetFormattedValue(rowIndexSet.First)
# Pass CellVal and Catval Variable value to document properties
Document.Properties["KCSel"] = CellVal
Document.Properties["CatSel"] = CatVal
2) Iron Python script to set X and Y zoom slider to default range
# Import Class
from Spotfire.Dxp.Application.Visuals import CombinationChart
# Set vis parameter value to "a" variable
a = vis.Title
for vis in Application.Document.ActivePageReference.Visuals:
if vis.Title == a:
MYchart = vis.As[CombinationChart]()
MYchart.XAxis.ZoomRange = AxisRange.DefaultRange
MYchart.YAxis.ZoomRange = AxisRange.DefaultRange
3) Iron Python script to set Document Property, Visualization Title and Marking:
# Import Class
from Spotfire.Dxp.Data import *
from Spotfire.Dxp.Data import IndexSet, DataValueCursor, RowSelection
rowCount = Document.Data.Tables["Equity Pivoted"].RowCount
rowsToInclude = IndexSet(rowCount,True)
cursor = DataValueCursor.CreateFormatted(Document.Data.Tables["Equity Pivoted"].Columns["CntrySelector"])
rowsToFilter = IndexSet(rowCount,False)
for row in Document.Data.Tables["Equity Pivoted"].GetRows(rowsToInclude,cursor):
rowIndex = row.Index
value1 = cursor.CurrentValue
if value1 == "Yes":
rowsToFilter.AddIndex(rowIndex)
Document.Data.Markings["Marking"].SetSelection(RowSelection(rowsToFilter), Document.Data.Tables["Equity Pivoted"])
rowIndexSet=Document.ActiveMarkingSelectionReference.GetSelection(Document.Data.Tables["Equity Pivoted"]).AsIndexSet()
CellVal = Document.Data.Tables["Equity Pivoted"].Columns["CalAtt"].RowValues.GetFormattedValue(rowIndexSet.First)
Document.Properties["KCSel"] =CellVal
vis.Title= 'Analysis Name: ' + CellVal
Document.Data.Markings["Marking"].SetSelection(RowSelection(rowsToFilter), Document.Data.Tables["Equity Pivoted"])
4) Iron Python script to Clear Marking:
# Import Class
from Spotfire.Dxp.Application.Visuals import ScatterPlot
v1 = vis.As[ScatterPlot]()
from Spotfire.Dxp.Data import RowSelection, IndexSet
#prepare to unmark all rows
rowSelection = RowSelection(IndexSet(dataTable.RowCount,False))
#set visualization data table marking based on rowSelection
v1.Data.MarkingReference.SetSelection(rowSelection,dataTable)
5) Iron Python script to Print all pages and Visualization:
for page in Document.Pages:
print page.Title
for vis in page.Visuals:
print " " + vis.Title

No comments:
Post a Comment