As we know every data visualization project consist of few step which need to follow during it's preparation. Likewise, To develop Spotfire data visualization project below steps need to be followed before it publish to end users.
Given below are steps which need to be follow to develop Spotfire data visualization project:
Given below are steps which need to be follow to develop Spotfire data visualization project:
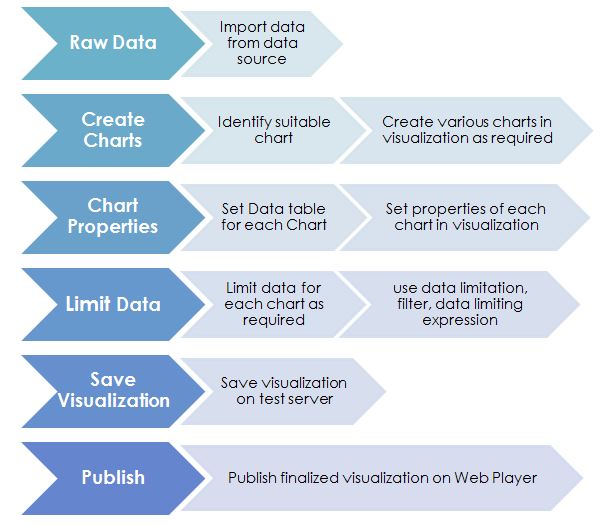
• Export raw data from various data source and perform data cleansing and data modeling
• Identify and create best chart for the analysis in the Visualization
•
Adjust chart properties for each visualization
•
Limit dataset for each chart using different filtering techniques like filter, data limiting expression, list and tags
•
Save visualization once it finished
•
Publish final visualization on Web Player for end users


No comments:
Post a Comment